Elasticsearch Using High RAM but Showing Low Heap Usage
High RAM but low heap usage in Elasticsearch isn't a memory leak. It's the OS filesystem cache at work. Here's how to verify it and when to worry.
Fatima Gull
Author
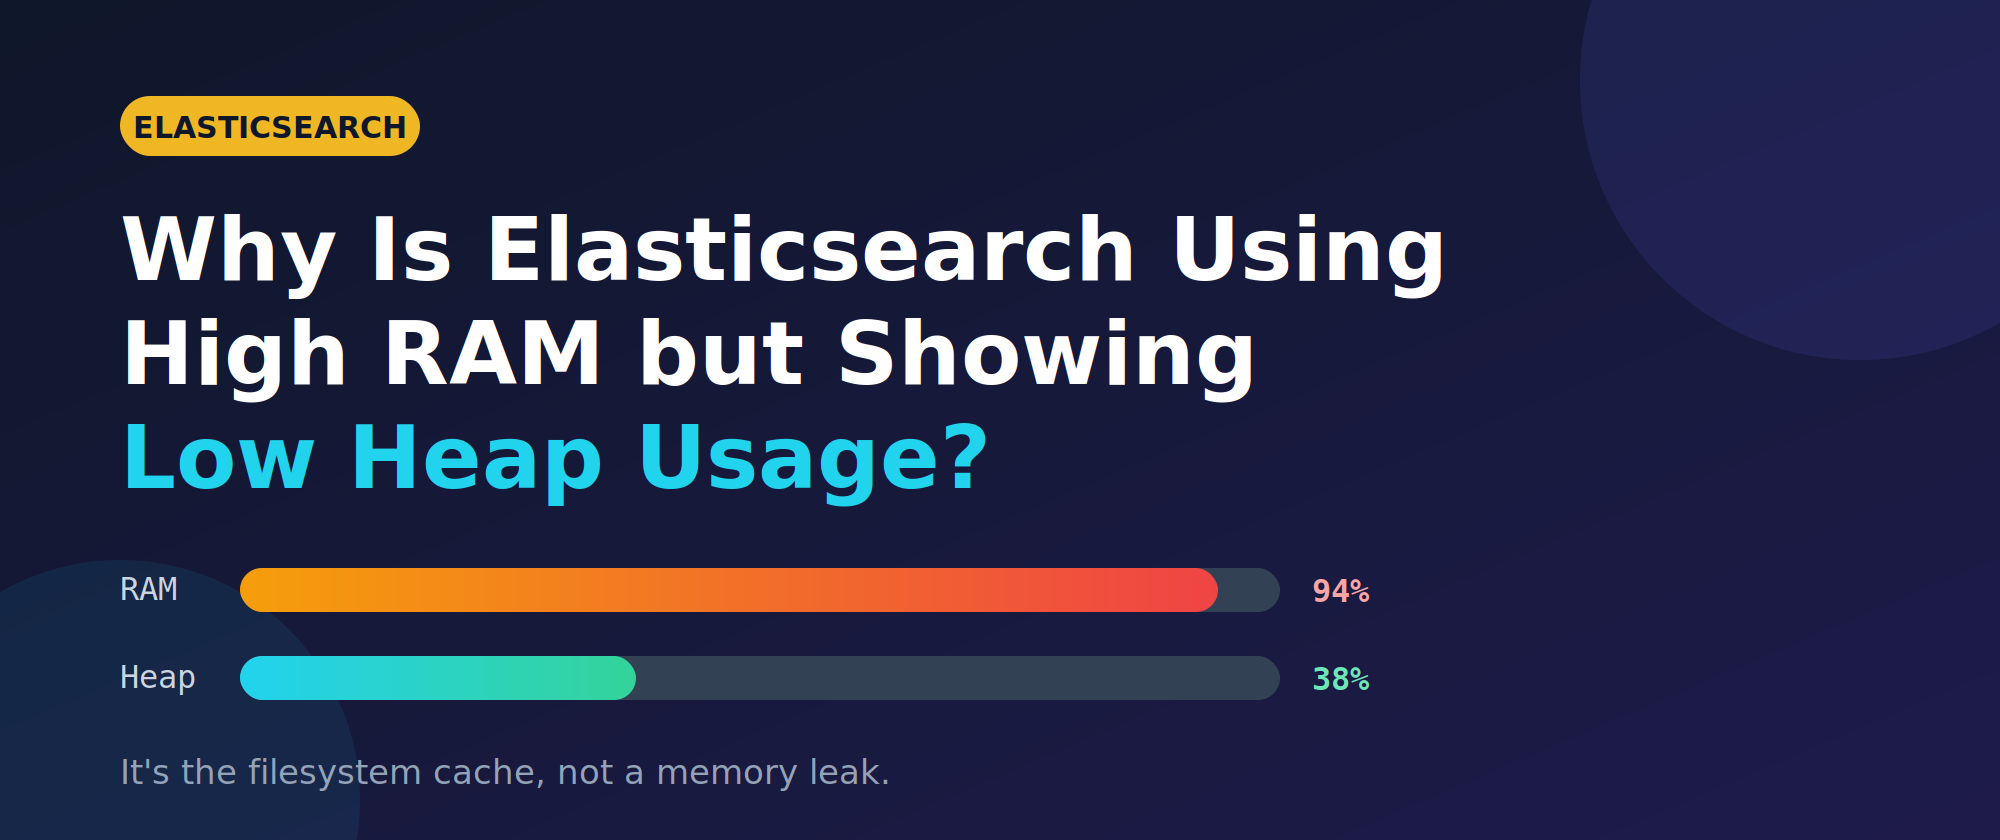
You open top on your Elasticsearch node and see 90%+ memory used. Then you check the cluster and heap usage sits comfortably at 30-40%. Is something leaking?
Almost certainly not. This is normal, and it's actually how Elasticsearch is designed to work.
The symptom
Run this against your cluster:
GET _cat/nodes?v&h=name,heap.percent,heap.max,ram.percent,ram.maxYou might see something like:
name    heap.percent heap.max ram.percent ram.max
node-1            38     16gb          94    32gb
Heap is at 38%, but RAM is at 94%. The two numbers measure different things.
Heap vs. everything else
Elasticsearch runs on the JVM, and the heap is only the memory the JVM manages for Java objects: caches, aggregations, cluster state, and in-flight requests. It's capped by -Xmx.
But a node's total memory use includes much more:
The JVM heap, which is the number you configure.
Off-heap JVM memory, such as direct buffers, metaspace, thread stacks, and the code cache.
The OS filesystem cache, usually the biggest piece.
The real answer: the filesystem cache
Elasticsearch is built on Apache Lucene, and Lucene stores its index in immutable segment files on disk. Instead of loading those files into the Java heap, Lucene relies on the operating system to cache them in RAM, using memory-mapped files (mmap) for much of the index data.
When a search touches a segment, the OS pulls the file pages into its page cache. Subsequent reads come straight from memory instead of disk, which is a huge performance win.
Tools like top, free, and ram.percent in _cat/nodes count this cache as "used" memory. But it's:
Reclaimable. If a process needs memory, the OS drops cached pages instantly.
Intentional. It's the main reason Elasticsearch searches are fast.
Not a leak. It grows to fill available RAM by design.
That's why Elastic's guidance is to leave at least half of your RAM outside the heap.
How to verify it
Check memory at the OS level:
free -hLook at the buff/cache column. On an Elasticsearch node it's typically large, and the available column shows how much memory can actually be reclaimed.
Then check JVM and OS stats from Elasticsearch:
GET _nodes/stats/jvm,osKey fields to compare:
jvm.mem.heap_used_percent: the heap pressure that actually matters.os.mem.used_percent: includes cache, so it's usually high.os.mem.free_in_bytesvs. total: remember that "free" excludes cache.
If the heap is healthy and available memory in free -h is still comfortable, you have nothing to fix.
Sizing the heap correctly
Two rules of thumb from Elastic's documentation:
Set the heap to no more than 50% of available RAM. The rest is for the filesystem cache and off-heap needs.
Keep the heap below roughly 31 GB. Above that threshold the JVM can no longer use compressed object pointers, and you lose memory efficiency.
Set both min and max to the same value in jvm.options.d/heap.options:
-Xms16g
-Xmx16g
Don't give Elasticsearch a giant heap hoping it will be faster. A larger heap means longer garbage collection pauses and less memory for the filesystem cache, so it's often slower.
When you should actually worry
High RAM alone isn't a problem. These are:
Heap consistently above ~75%, especially if it doesn't drop after garbage collection. That points to real heap pressure.
Swapping. Elasticsearch performs badly if the heap is swapped out. Disable swap or use
bootstrap.memory_lock: true.OOM kills. Check
dmesgor your logs for the kernel killing the process.Container limits. In Docker or Kubernetes, page cache can count toward the cgroup memory limit. If your limit is too tight, the container can be throttled or killed even when the heap looks fine. Leave generous headroom above the heap size.
Circuit breaker trips. Errors like
CircuitBreakingExceptionmean the heap is under real strain.
Quick checklist
Heap (
-Xmx) is ≤ 50% of RAM and under ~31 GBheap.percentis stable and not pinned above 75%availablememory infree -his healthySwap is disabled or memory lock is enabled
Container memory limits leave room for the filesystem cache
Conclusion
High RAM usage with low heap usage in Elasticsearch isn't a bug. It's the OS filesystem cache doing its job. Watch heap usage, garbage collection behavior, and swap, not the raw RAM percentage. Treat that cache as a feature, size your heap conservatively, and let the OS use the rest.